On this page
Introduction to Optimum Design
3. Graphical Solution Method and Basic Optimization Concepts
- Graphical Solution Method: 도식해법
- 이 장의 주요내용:
2개의 설계변수를 가진 최적화 문제를 도식해법으로 풀이
제약조건들을 그려서 나타내고, 그 유용/불용영역 확인
그래프에서 문제의 유용집합/불용영역 집합 확인
유용영역에서 목적함수의 등축선 그리기
도해적으로 문제의 최적해의 위치를 표시하고, 활성화/만족 제약조건을 확인
복수해 문제, 무한해 문제, 불용해 문제를 확인
최적 설계에 관련된 기본적 개념과 용어 설명
- e.g., Profit maximization problem
A company manufactures two machine A and B.
28A or 14B can be manufactured daily.
14A or 24B can be sold daily.
16 machines can be handled daily.
$400 profit/A, $600 profit/B
- How many A and B machines should the company manufacture everyday to maximize its profits?
첫번째 방식: Mathematical formulation (이런 형식은 최적설계에선 사용하지 않는다. 비교를 위한 예시)
Manufacturing constraint: \(\frac{A}{28} + \frac{B}{14} \le 1\)
Sales constraint: \(\frac{A}{14} + \frac{B}{24} \le 1\)
Shipping and handling constraint: \(A+B \le 16\)
Non negative constraint(표현은 안돼있으나, hidden constraint): \(A\ge 0, B\ge 0\)
profit: \(p = 400A + 600B\)
두번째 방식: Standard design optimization model (이런 형식으로 사용한다!)
- \(\text{minimize}_x f(x)\ \text{subject to}\ g_i(x)\le 0, \ i=1, 2, ..., 5\)
Design variables \(x = \{x_1, x_2\}\)
Objective function \(f(x) = -p = -400x_1-600x_2\)
inequality constraints
\(g_1(x) = \frac{x_1}{28} + \frac{x_2}{14}-1 \le 0\)
\(g_2(x) = \frac{x_1}{14} + \frac{x_2}{24}-1 \le 0\)
\(g_3(x) = x_1 + x_2 - 16 \le 0\)
\(g_4(x) = -x_1 \le 0\)
\(g_5(x) = -x_2 \le 0\)
- Feasible set \(S = (x|h_j(x)=0, g_i(x)\le 0)\)
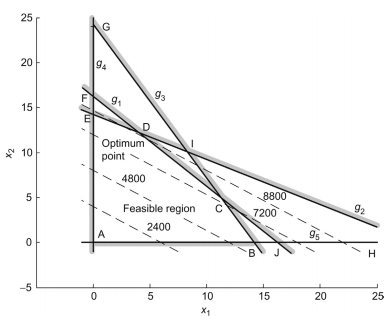
그림으로 나타내면 다음과 같다.

“Shaded out” 부분은 Infeasible region
D부분이 optimum point, \(x^* = \{A^*, B^*\} = (4, 12)\)
Contour (or level set) → a curve with the same objective function value
optimum과 만나는 constraint인 \(g_1, g_3\)은 active constraint,
만나지 않는 constraint인 \(g_2, g_4, g_5\)은 inactive constraint
3.1 도식해법 과정
3.1.1 이익 최대화 문제 - 정식화
Graphical
Mathematical
Numerical
방법은 3가지가 있다.