[1, 4, 9, 16]파이썬 자료형
a.f() 형태를 읽는 팁
a.f()는f(a)로 생각하면 편리함a.f(2)는f(a,2)로 생각하면 편리함
리스트 컴프리헨션
튜플
인덱싱고급 (스트라이딩)
스트라이딩 [start:stop:step]
# 주어진 리스트에서 x_i>80 의 조건을 만족하는 원소의 갯수는?
x = [80,60,80,90,55,85,95,100,35,70,75,65,95]
sum([i>80 for i in x])5리스트 컴프리헨션을 이용하여 \[ z = [x_1^2 + y_1^2, ... , x_8^2+y_8^2] = [x_i^2 + y_i^2 : \text{for}\ i = 1,2,3,...,8] \] 와 같은 리스트를 생성하라.
[10, 8, 17, 26, 40, 29, 52, 98]아래와 같은 문자열이 있다고 하자.
test_arr = 'ssh-rsa AAAAB3NzaC1yc2EAAAABIwAAAQEAklOUpkDHrfHY17SbrmTIpNLTGK9Tjom/BWDSUGPl+nafzlHDTYW7hdI4yZ5ew18JH4JW9jbhUFrviQzM7xlELEVf4h9lFX5QVkbPppSwg0cda3Pbv7kOdJ/MTyBlWXFCR+HAo3FXRitBqxiX1nKhXpHAZsMciLq8V6RjsNAQwdsdMFvSlVK/7XAt3FaoJoAsncM1Q9x5+3V0Ww68/eIFmb1zuUFljQJKprrX88XypNDvjYNby6vw/Pb0rwert/EnmZ+AW4OZPnTPI89ZPmVMLuayrD2cE86Z/il8b+gw3r3+1nKatmIkjn2so1d01QraTlMqVSsbxNrRFi9wrf+M7Q== schacon@mylaptop.local'이 문자열에서 대문자의 수를 count하라.
Numpy
array([0.        , 0.09090909, 0.18181818, 0.27272727, 0.36363636,
       0.45454545, 0.54545455, 0.63636364, 0.72727273, 0.81818182,
0.90909091, 1. ])array([ 0.10617284, 0.72375906, 0.21798968, 0.19402231, -0.68898998,
-0.35166964, 0.99093298, 1.21214682, -0.60896544, 0.03254898])array([0.42891863, 0.34443157, 0.58565357, 0.95396214, 0.88773763,
0.02981978, 0.40022832, 0.32824551, 0.52936974, 0.52123622])array([[-0.38160921, -0.94802082],
[ 0.45375798, -0.71627028]])행렬 관련 기능
Numpy: axis의 이해
두번째 차원을 바꾸고 싶다 -> 두번째 축을 바꾸고 싶다 -> axis = 1 (파이썬은 0부터 시작)
값이 바뀌는 부분이 axis
ex)
a.shape, b.shape, np.concatenate([a,b],axis=1).shape


((2, 3, 4), (2, 3, 4), (2, 6, 4))
ex)
Pandas
행과 열의 선택
np.random.seed(43052)
att = np.random.choice(np.arange(10,21)*5,20)
rep = np.random.choice(np.arange(5,21)*5,20)
mid = np.random.choice(np.arange(0,21)*5,20)
fin = np.random.choice(np.arange(0,21)*5,20)
student_id = ['2022-12'+str(s) for s in np.random.choice(np.arange(300,501),20,replace=False)]

df2 = pd.DataFrame({'id':student_id,'att':att,'rep':rep,'mid':mid,'fin':fin})
df2.head()| id | att | rep | mid | fin | |
|---|---|---|---|---|---|
| 0 | 2022-12380 | 65 | 55 | 50 | 40 |
| 1 | 2022-12370 | 95 | 100 | 50 | 80 |
| 2 | 2022-12363 | 65 | 90 | 60 | 30 |
| 3 | 2022-12488 | 55 | 80 | 75 | 80 |
| 4 | 2022-12312 | 80 | 30 | 30 | 100 |
가장 안전한 코드
df.loc[:,:]
상황: 하나의 col을 뽑으려 할 때 좋은 코드
df.att or df['att']
상황: row 슬라이싱 할 때 좋은 코드(★★★)
df[:5]
위의 상황 이외에는 df.loc[:,:]를 사용하는 것이 유리하다.
상황: column 슬라이싱 할때
df.loc[:, 'att':'mid']
상황: row + column 슬라이싱하는 가장 좋은 코드
df.loc[0:5, 'att':'mid']
상황: 조건에 맞는 col을 뽑기에 가장 좋은 코드
df.loc[:, [len(col_name)>2 for col_name in df.columns]]
상황: 조건에 맞는 row, col을 뽑기에 가장 좋은 코드
df.loc[df.att<60, [len(col_name)>2 for col_name in df.columns]]
- 여러 열을 뽑을때에는 리스트로 묶어주어야함. ex)
df.loc[:, ['B','C']]
lambda
람다표현식(lambda expression) 자체가 하나의 오브젝트임.
람다 표현식에 이름을 줄 수 있음
위의 코드는 아래와 같다.
조건부 출력
map
list(map(함수, input))
s.apply(변환함수)
Matplotlib
Boxplot
Boxplot의 장점: 단순히 평균을 주는 것보다 데이터를 파악하고 직관을 얻기에 유리하다.
y1=[75,75,76,76,77,77,78,79,79,98] # A선생님에게 통계학을 배운 학생의 점수들
y2=[76,76,77,77,78,78,79,80,80,81] # B선생님에게 통계학을 배운 학생의 점수들

print(f"A의 평균: {np.mean(y1)}, B의 평균: {np.mean(y2)}")
plt.boxplot([y1,y2]);
A의 평균: 79.0, B의 평균: 78.2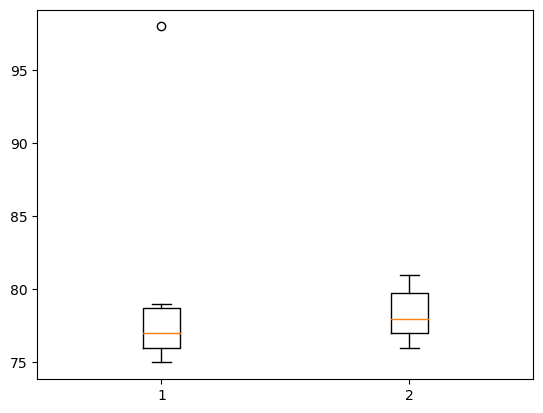
정규분포가정을 하는 법(데이터를 보고 어떻게 정규분포라고 알 수 있는가?): 데이터의 히스토그램을 그려서 종 모양이 되는지 확인해본다.
Histogram
히스토그램 : X축이 변수의 구간, Y축은 그 구간에 포함된 빈도를 의미하는 그림
y=[10,11,12,15,16,20,21,22,23,24,25]
plt.hist(y, bins=10, range=[0,30]);
# ;으로 결과 생략하기.
# bins : 가로축 구간의 갯수(막대의 갯수)
# range : 가로축의 범위 지정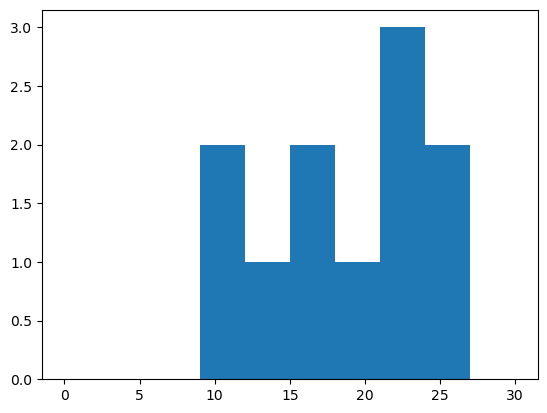
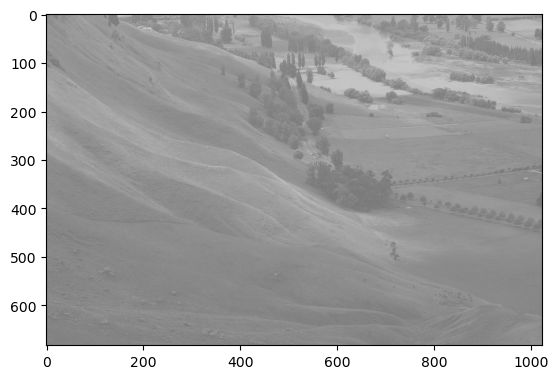
Histogram 응용 예제
!wget 주소: 주소에 있는 이미지를 다운로드
!rm 파일이름: 현재폴더에 “파일이름”을 삭제
다만 이런 명령어는 리눅스 기반에서 동작. 윈도우 환경에서는 동작하지 않는다.
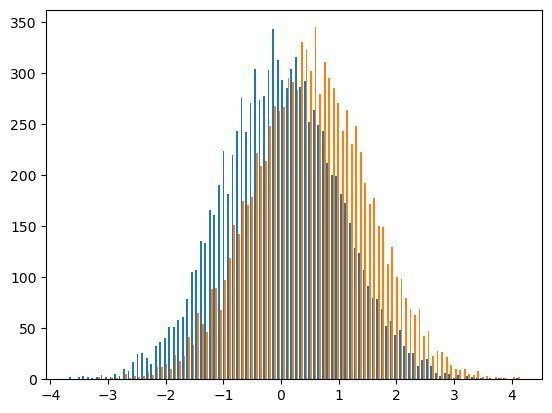
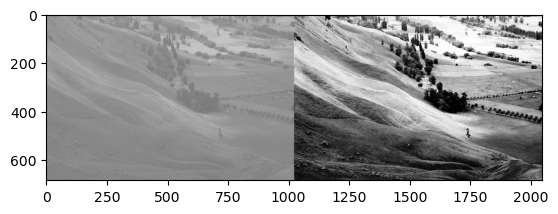
# 이미지를 rgb로 각각 분리하고 각 색깔들의 히스토그램을 그려보기.

r= img[:,:,0] # 빨강(R)
g= img[:,:,1] # 녹색(G)
b= img[:,:,2] # 파랑(B)

plt.hist(r.reshape(-1),bins=255,range=(0,255));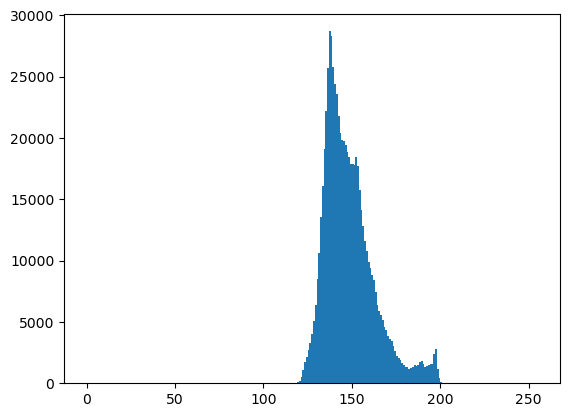
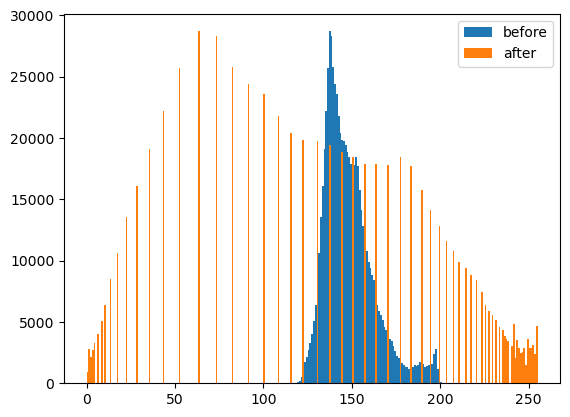
- cv2.equalizeHist()를 이용하여 분포의 모양은 대략적으로 유지하면서 값을 퍼트리자!
Line plot
- r–등의 옵션은 Markers + Line Styles + Colors 의 조합으로 표현가능
ref: https://matplotlib.org/stable/api/_as_gen/matplotlib.pyplot.plot.html
--r: 점선(dashed)스타일 + 빨간색r--: 빨간색 + 점선(dashed)스타일:k: 점선(dotted)스타일 + 검은색k:: 검은색 + 점선(dotted)스타일
Line Styles
| character | description |
|---|---|
| ‘-’ | solid line style |
| ‘–’ | dashed line style |
| ‘-.’ | dash-dot line style |
| ‘:’ | dotted line style |
Colors
| character | color |
|---|---|
| ‘b’ | blue |
| ‘g’ | green |
| ‘r’ | red |
| ‘c’ | cyan |
| ‘m’ | magenta |
| ‘y’ | yellow |
| ‘k’ | black |
| ‘w’ | white |
Markers
| character | description |
|---|---|
| ‘.’ | point marker |
| ‘,’ | pixel marker |
| ‘o’ | circle marker |
| ‘v’ | triangle_down marker |
| ‘^’ | triangle_up marker |
| ‘<’ | triangle_left marker |
| ‘>’ | triangle_right marker |
| ‘1’ | tri_down marker |
| ‘2’ | tri_up marker |
| ‘3’ | tri_left marker |
| ‘4’ | tri_right marker |
| ‘8’ | octagon marker |
| ‘s’ | square marker |
| ‘p’ | pentagon marker |
| ‘P’ | plus (filled) marker |
| ’*’ | star marker |
| ‘h’ | hexagon1 marker |
| ‘H’ | hexagon2 marker |
| ‘+’ | plus marker |
| ‘x’ | x marker |
| ‘X’ | x (filled) marker |
| ‘D’ | diamond marker |
| ‘d’ | thin_diamond marker |
| ‘|’ | vline marker |
| ’_’ | hline marker |
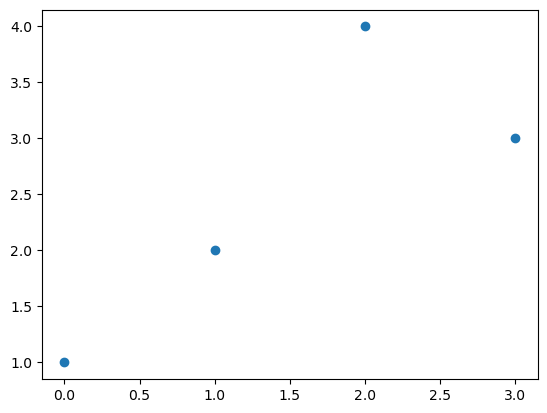
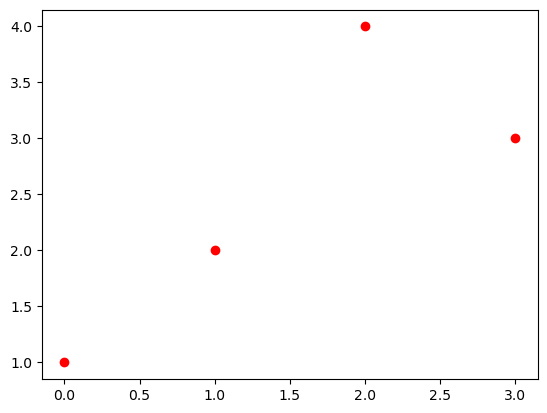
Scatter plot
마커를 설정하면 끝
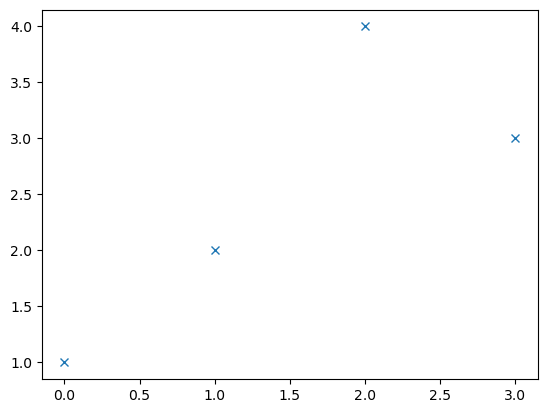
색깔변경
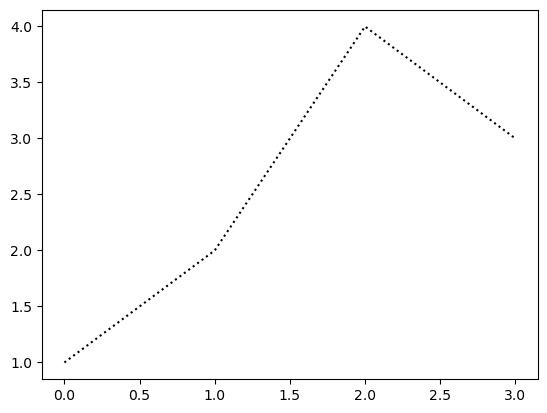
dot-connected plot
마커와 라인스타일을 동시에 사용하면 dot-connected plot이 된다.
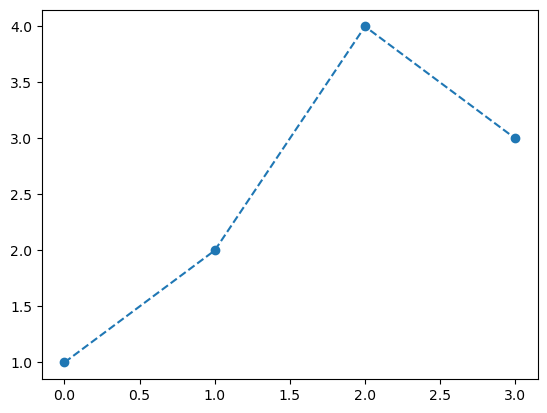
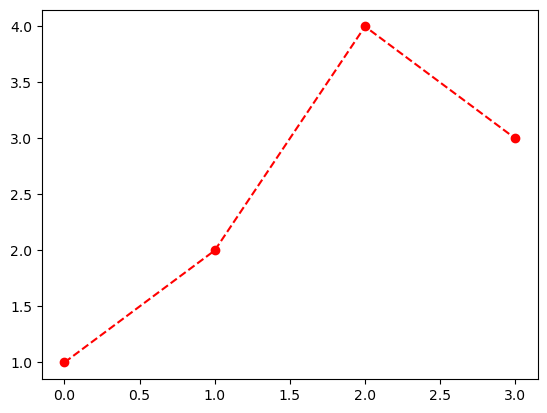
순서를 바꿔도 상관없다.
ex) --or r--o 등..
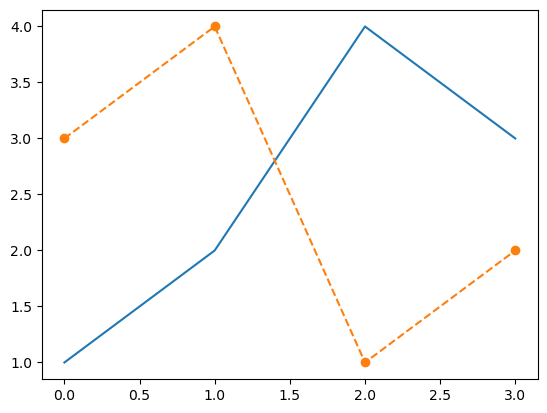
겹쳐 그리기
x = np.linspace(0,1,100)
eps = np.random.randn(100)*0.2
y = 2*x + eps
plt.plot(x,y,'o')
plt.plot(x,2*x,'--',lw=3)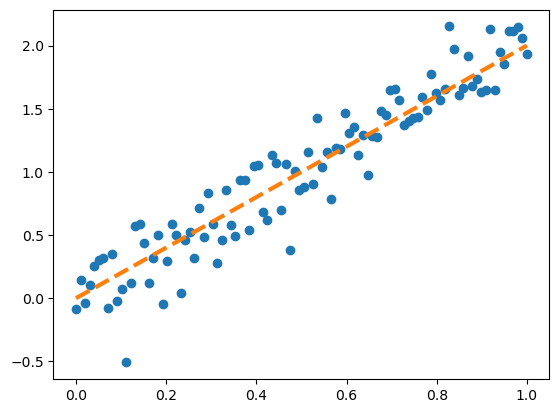
Summary
- 라인플랏: 추세
- 스캐터플랏: 두 변수의 관계
- 박스플랏: 분포(일상용어)의 비교, 이상치
- 히스토그램: 분포(통계용어)파악
- 바플랏: 크기비교